
Assets & data model
Configure data types, properties, references and locations.
Explore the data modelThe Conneqt platform
Combine assets, process logic and the interfaces people use. Configure Conneqt around your organisation.
A closer look at the platform
Present the same data in the form your work needs: a table, tiles, a map, a calendar or a timeline. Combine these views with reusable widgets and use roles to define who can view, change and use the data.
Configure data types, properties, references and locations.
Explore the data modelDesign user interaction, decisions and background tasks within a process.
Explore processesView data in five ways and save filters for reuse.
Explore data viewsBring overviews, charts, properties and actions into one workspace.
Explore dashboardsDefine access to data, individual properties and processes.
Explore access and API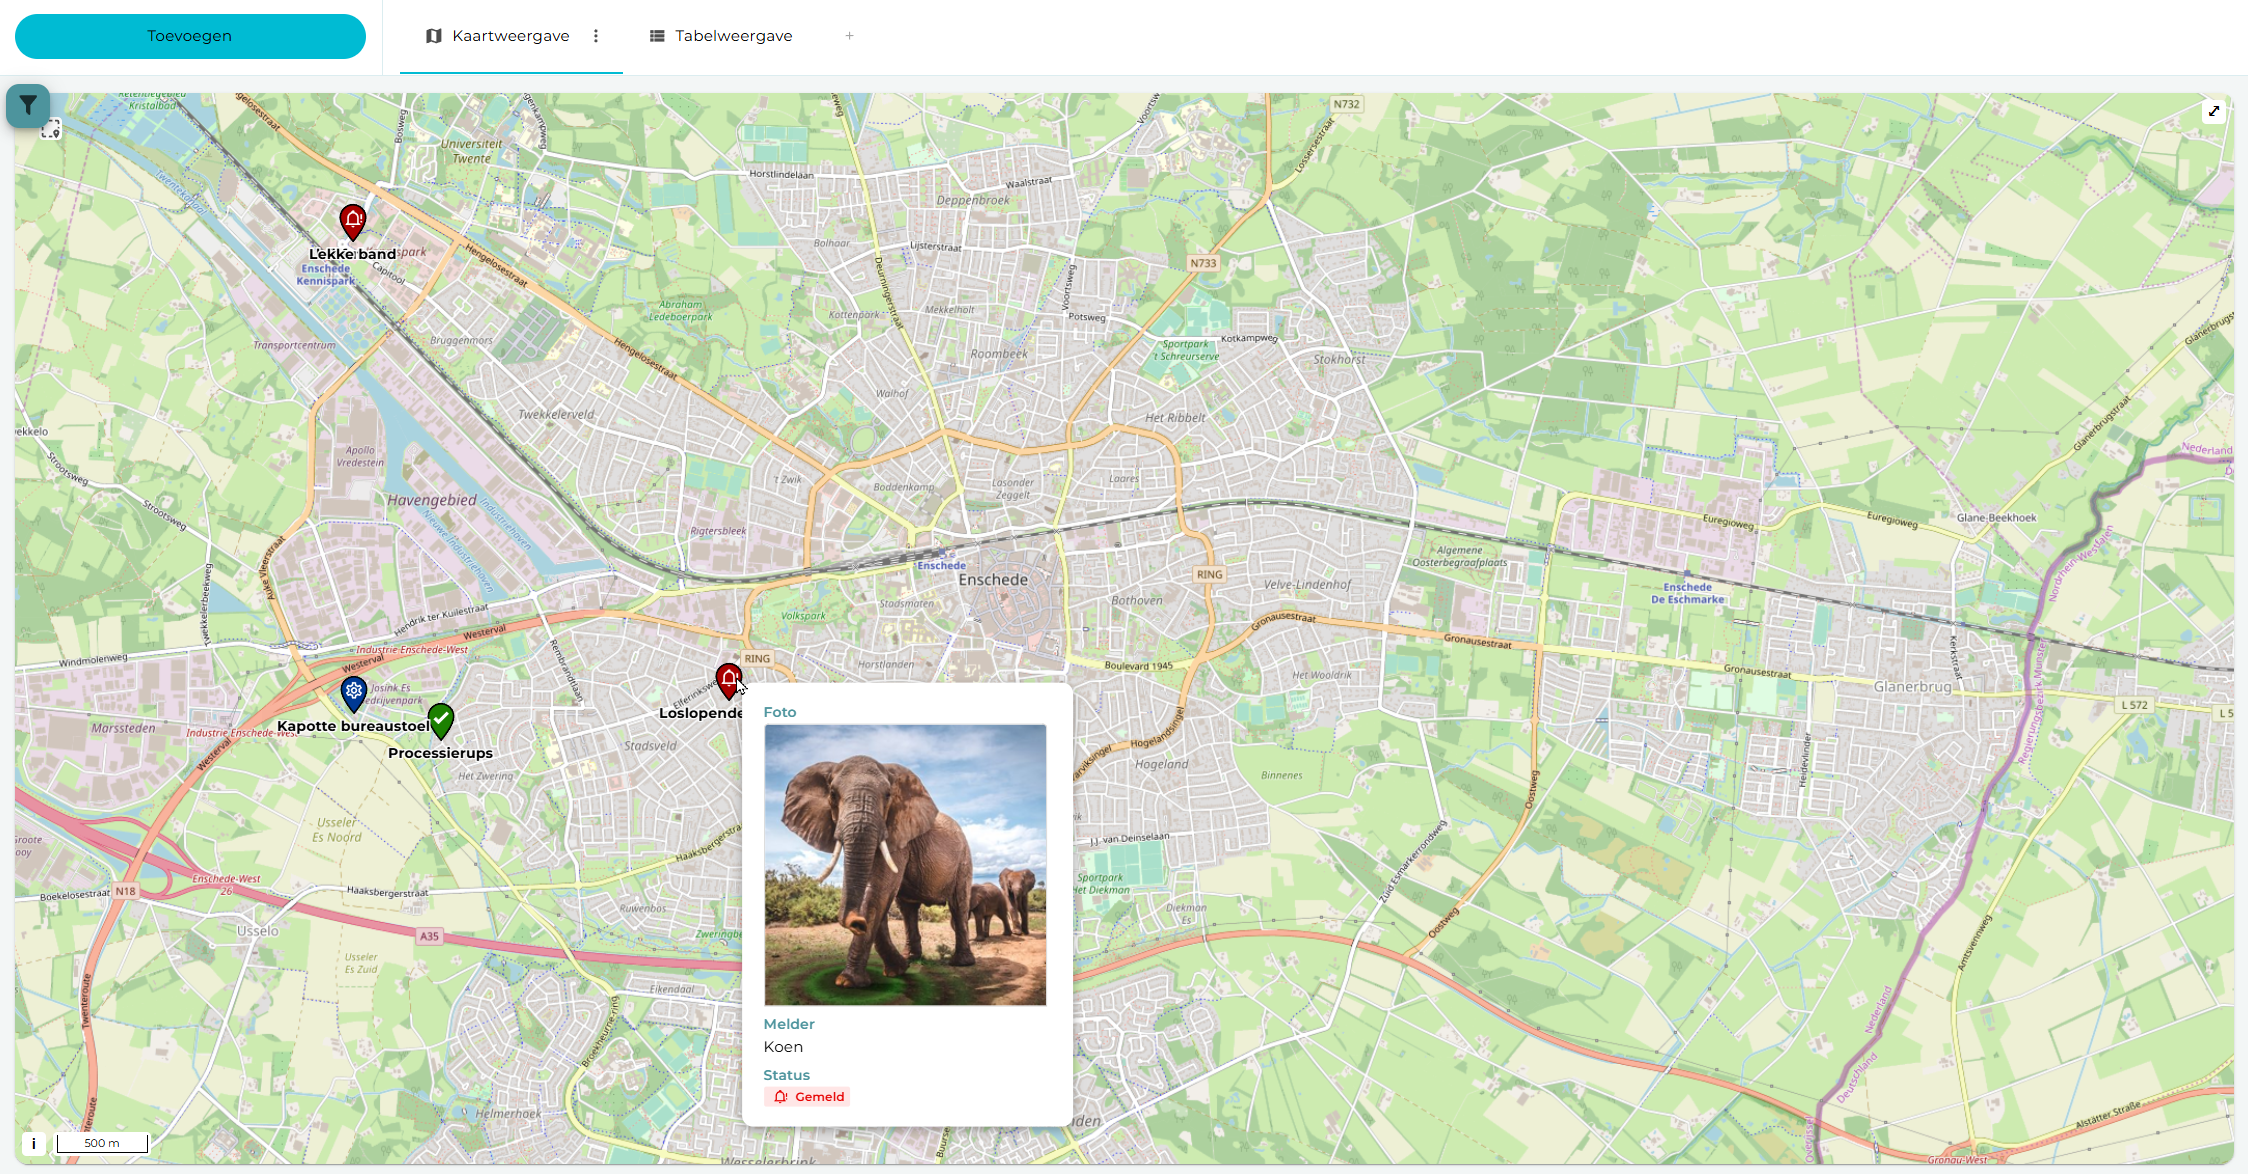
01 · Assets & data
An asset is a record you want to manage, such as a location, vehicle or report. You define its properties and how it relates to other assets.
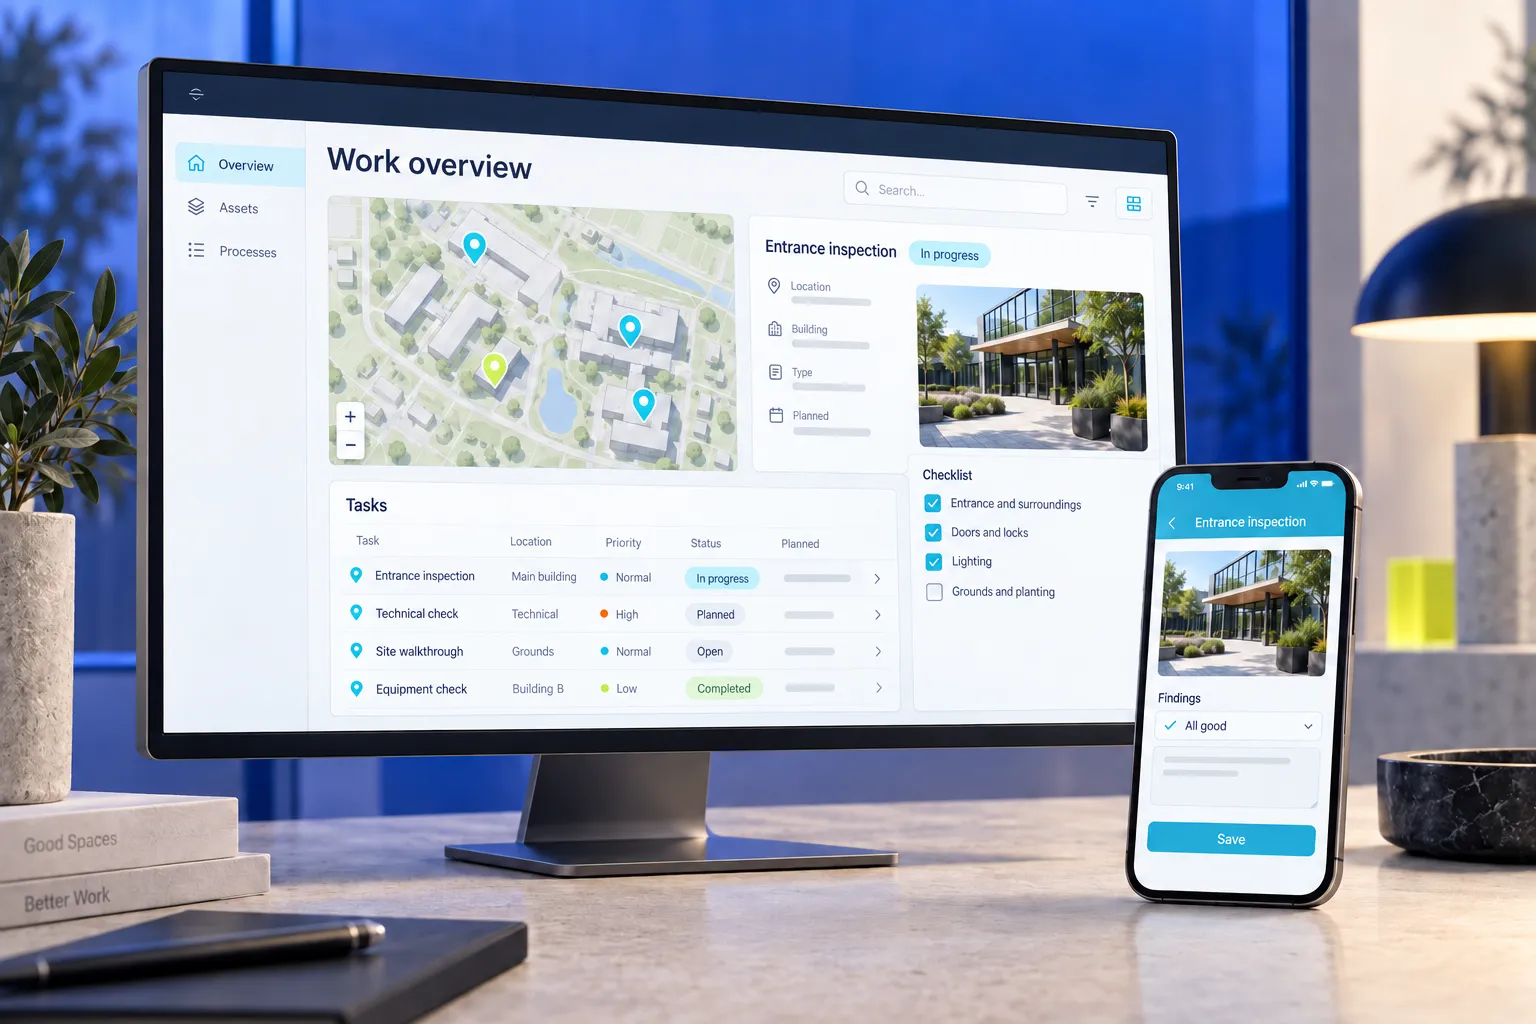
Illustrative configuration with fictional data. Your process defines the screen.
02 · Processes & automation
Assemble processes visually using inputs, logic and actions. Let users run a process, or use a change in data as a starting point.
03 · Forms & mobile
Ask for the information you need. Let colleagues complete forms, add photos or use a scan as input — in the office or on location.
Available input depends on the process configuration and device.
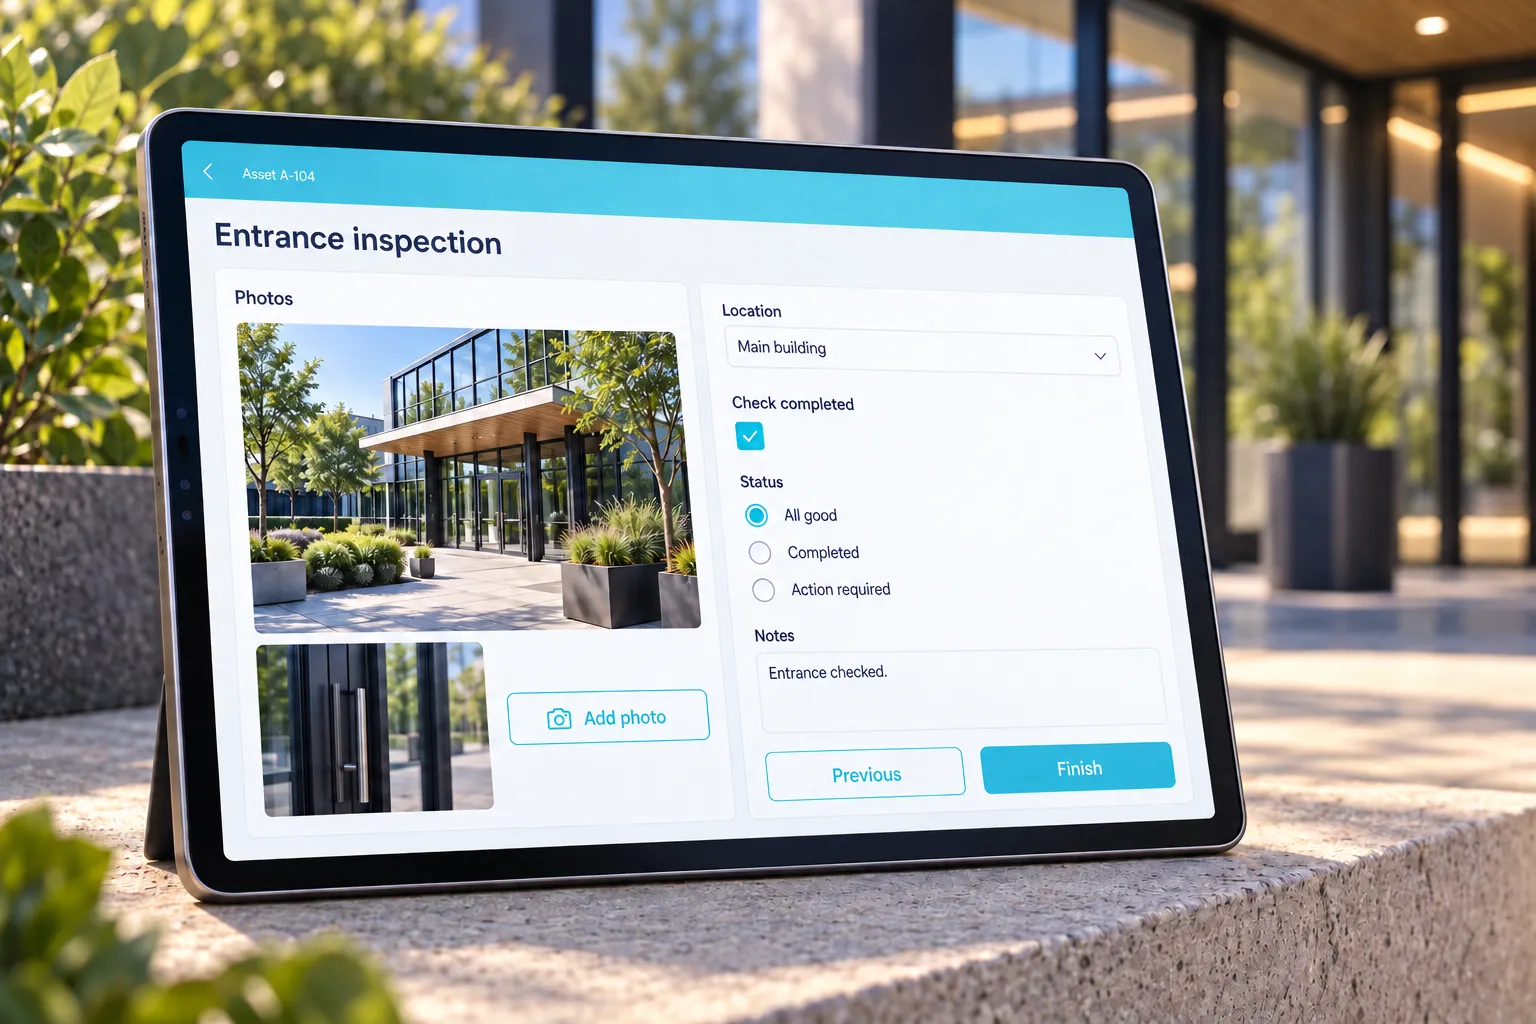
Illustrative configuration with fictional data. Your process defines the screen.
04 · Dashboards, maps & planning
Bring data together in numbers, charts and overviews. Use maps for location data and planning for resource allocation.
Conceptual map with fictional objects.
05 · Integrations & access
Retrieve information through APIs or send data to other systems from within processes. Configure who can use data and run processes.
AI & MCP
Let AI assistants work with your Conneqt processes through MCP. They can discover and run available processes within the configured permissions and process logic.
MCP connects the assistant to the processes you make available for it.
Discuss your processYou define the available processes and access permissions.