
Table
View data in rows and columns, with a configured column order and sorting.
Platform · Dataviews
A table for an overview, a map for locations or a timeline for planning. Dataviews make Assets useful for different tasks and users in the web portal.
Five ways to look
The standard dataviews in the web portal display records from an AssetType. Choose the presentation that best supports the task.
View data in rows and columns, with a configured column order and sorting.
Present Assets as cards in a CardView.
Show Assets on a geographic map with recognisable markers.
Place Assets with start and end times in a calendar.
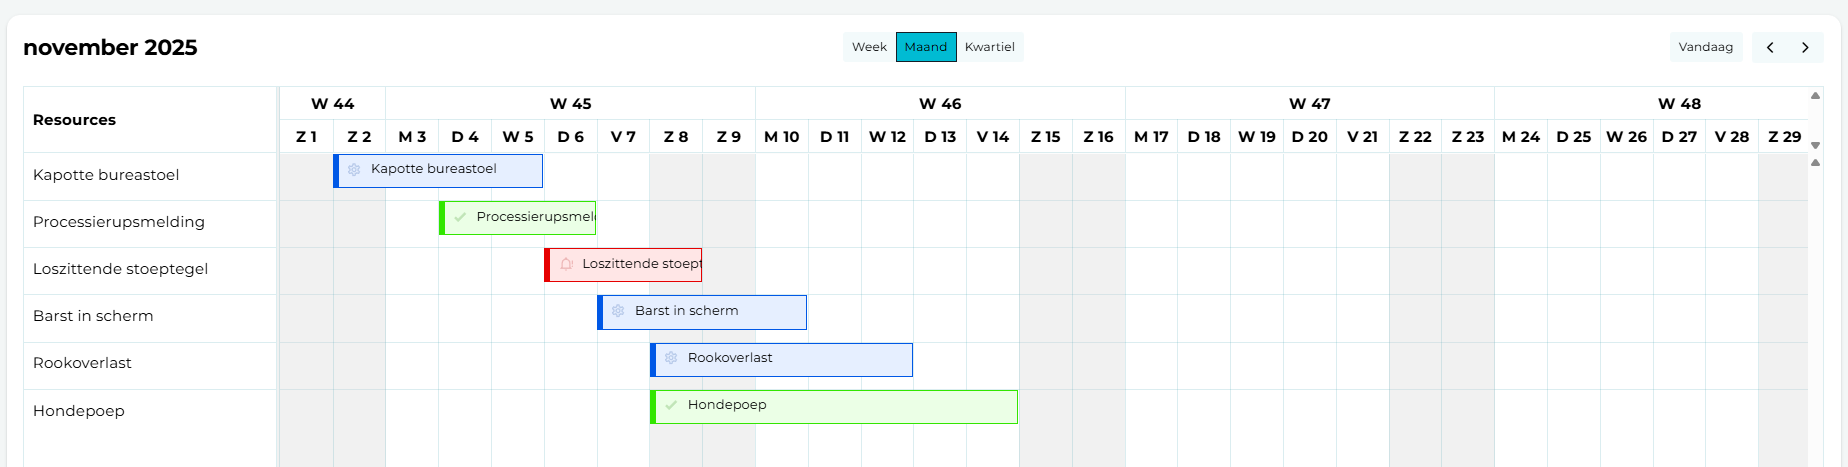
Display Assets with start and end times in a grouped Gantt view.
From all records to your selection
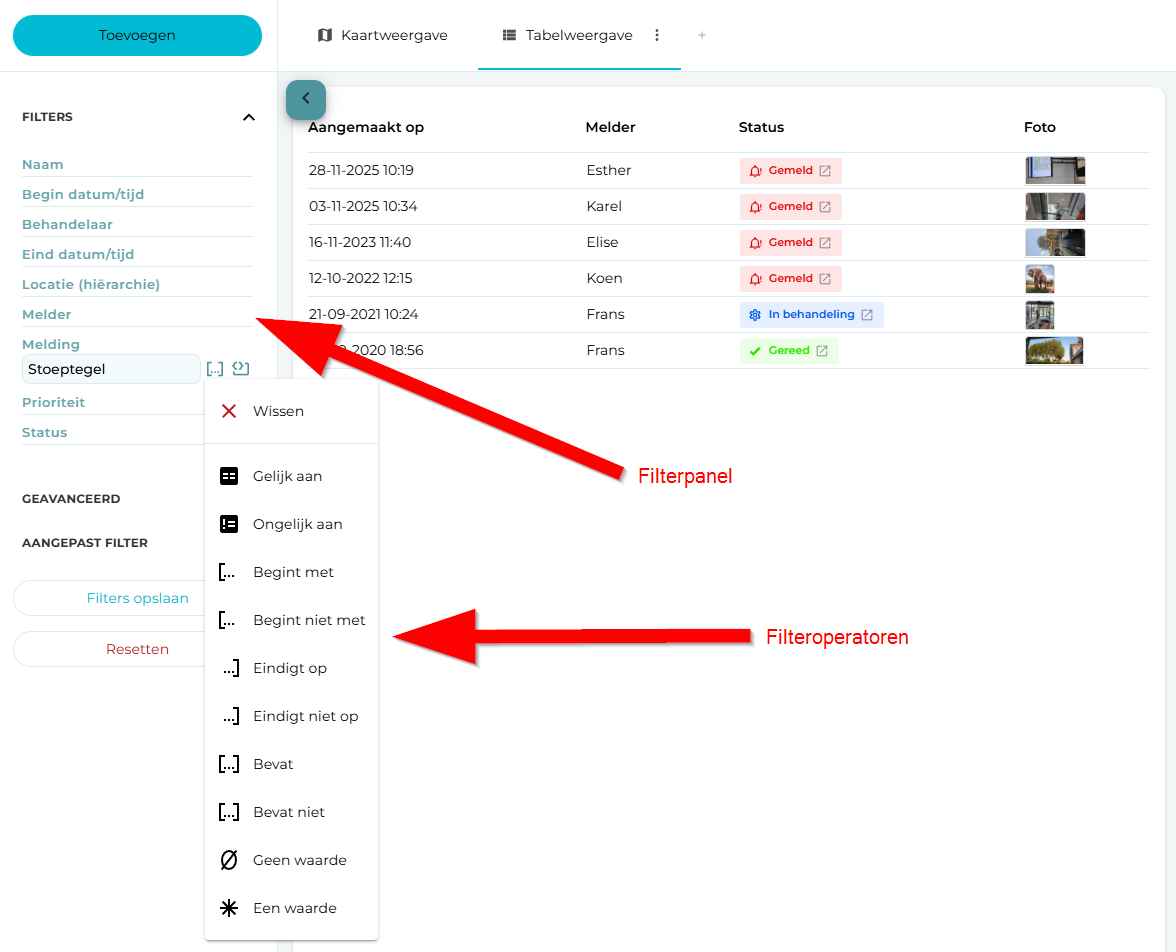
In the filter panel, users choose properties and an appropriate comparison: equals, starts with, ends with, contains, no value or the inverse of these options.
A filter value can be fixed or depend on a context variable, such as the signed-in user or their department. This supports selections such as ‘My reports’ and ‘Reports from my department’. Relative dates let you select a period such as the previous week.
Save a filter to use it again. Consultants can also create filters through the general filter menu. The same saved filters can be used in processes, aggregations and chart widgets on dashboards. Filters define the selection; rights and roles determine access.
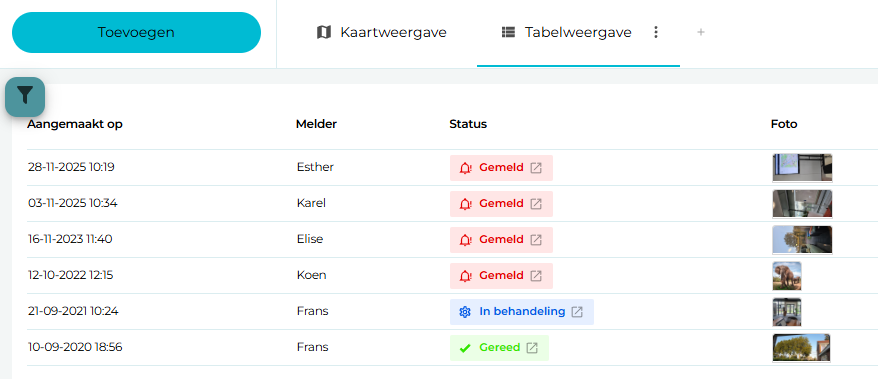
TableView
In the table view, configure which AssetType properties are visible, the order of the columns and the property used for sorting.
This creates a focused working view of requests, objects or activities, for example. Clicking an Asset can open its details or start a process.
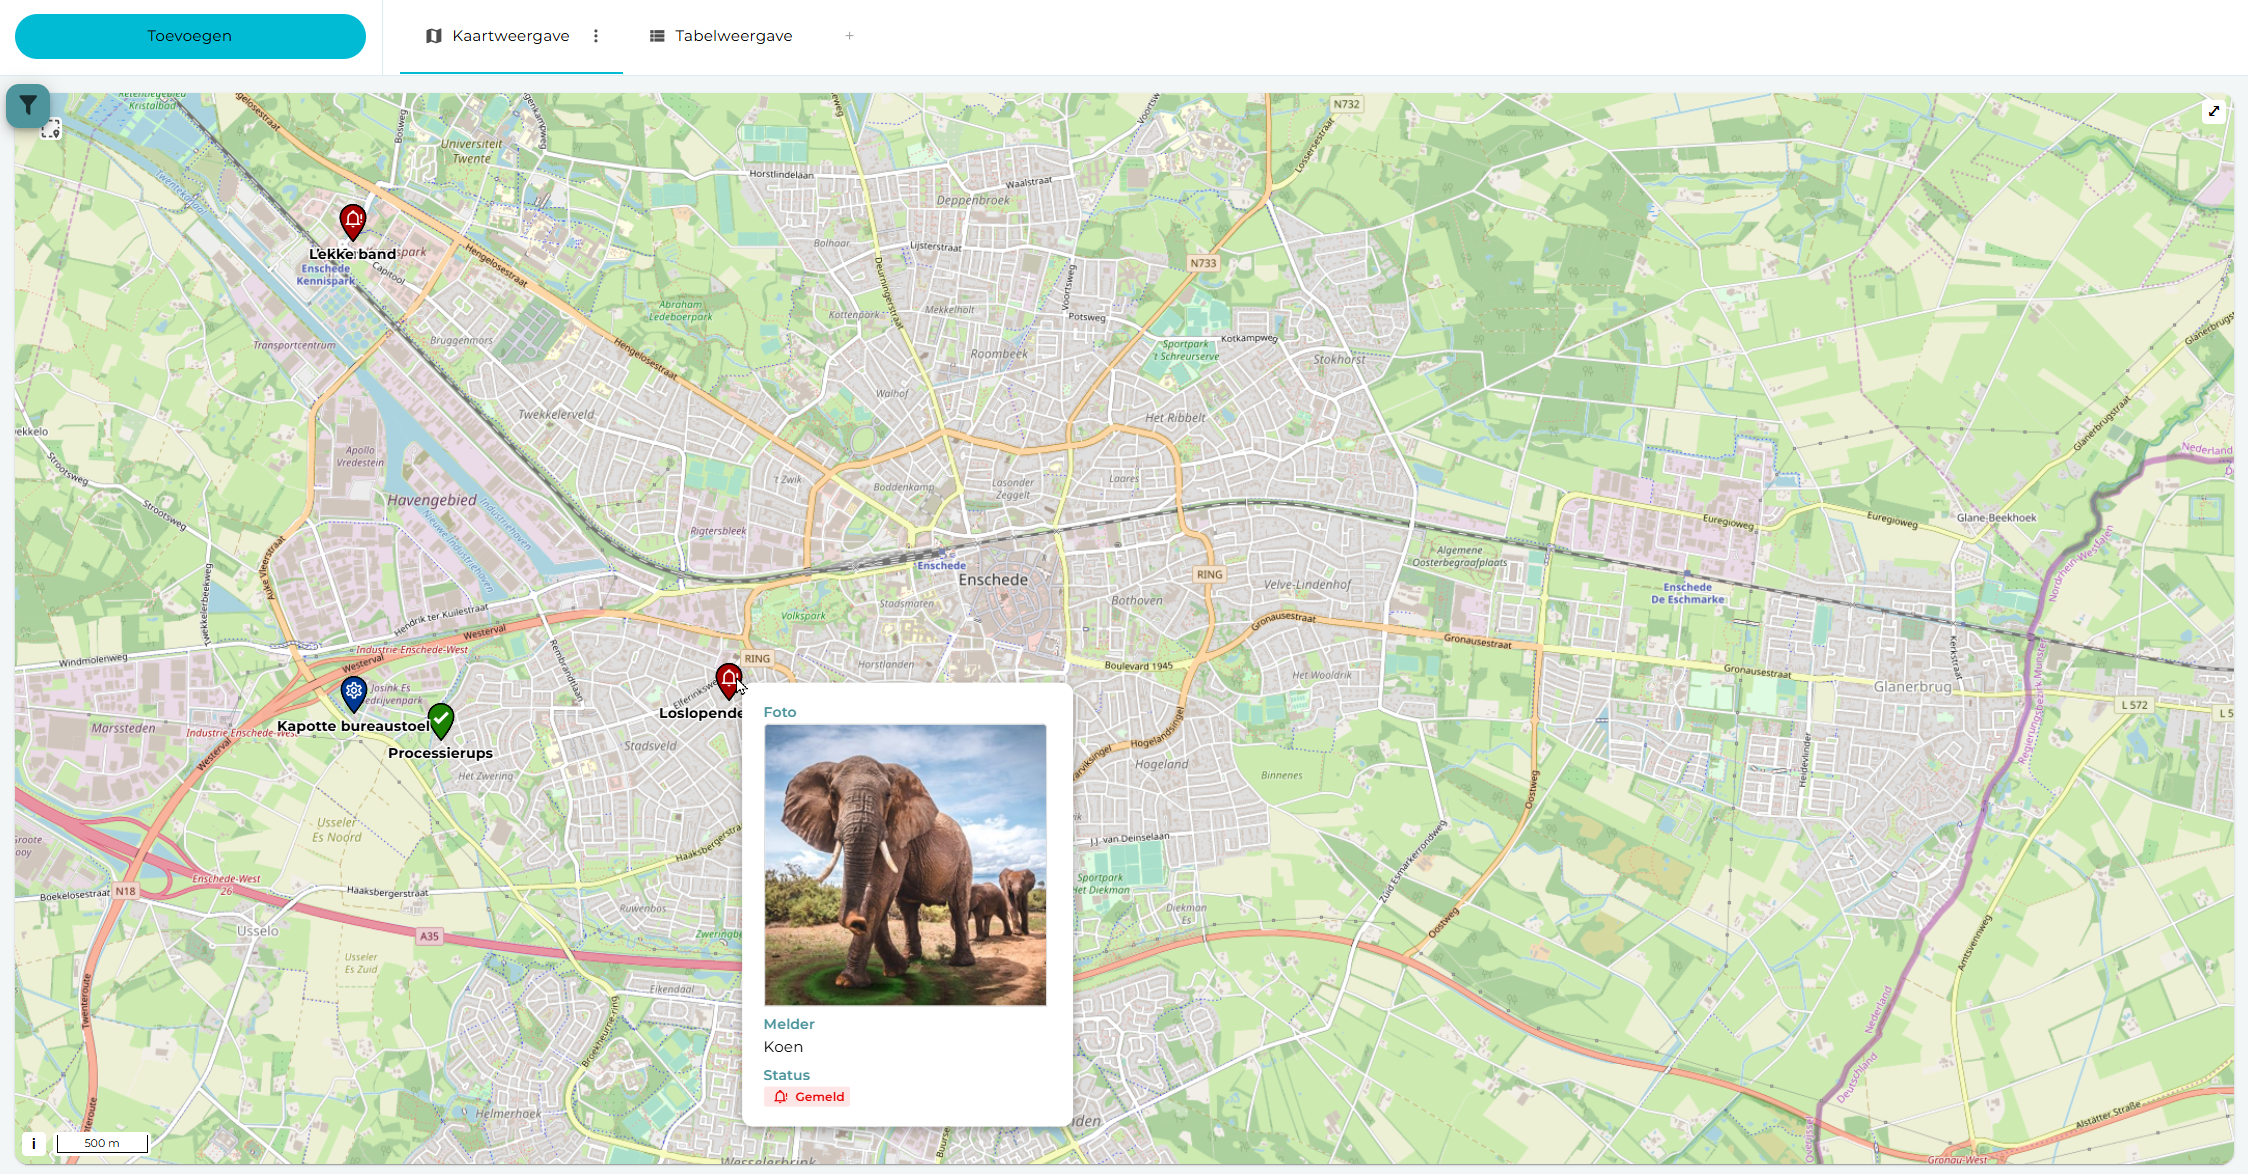
MapView
The map view displays Assets on OpenStreetMap. Configure the property used for marker labels, the properties shown in tooltips, and how icons and colours are selected. Tooltips can include images too.
Icon and colour mapping can reference a related Asset. A marker can then use the icon and colour of a status, for example. This keeps the meaning on the map connected to your data model.
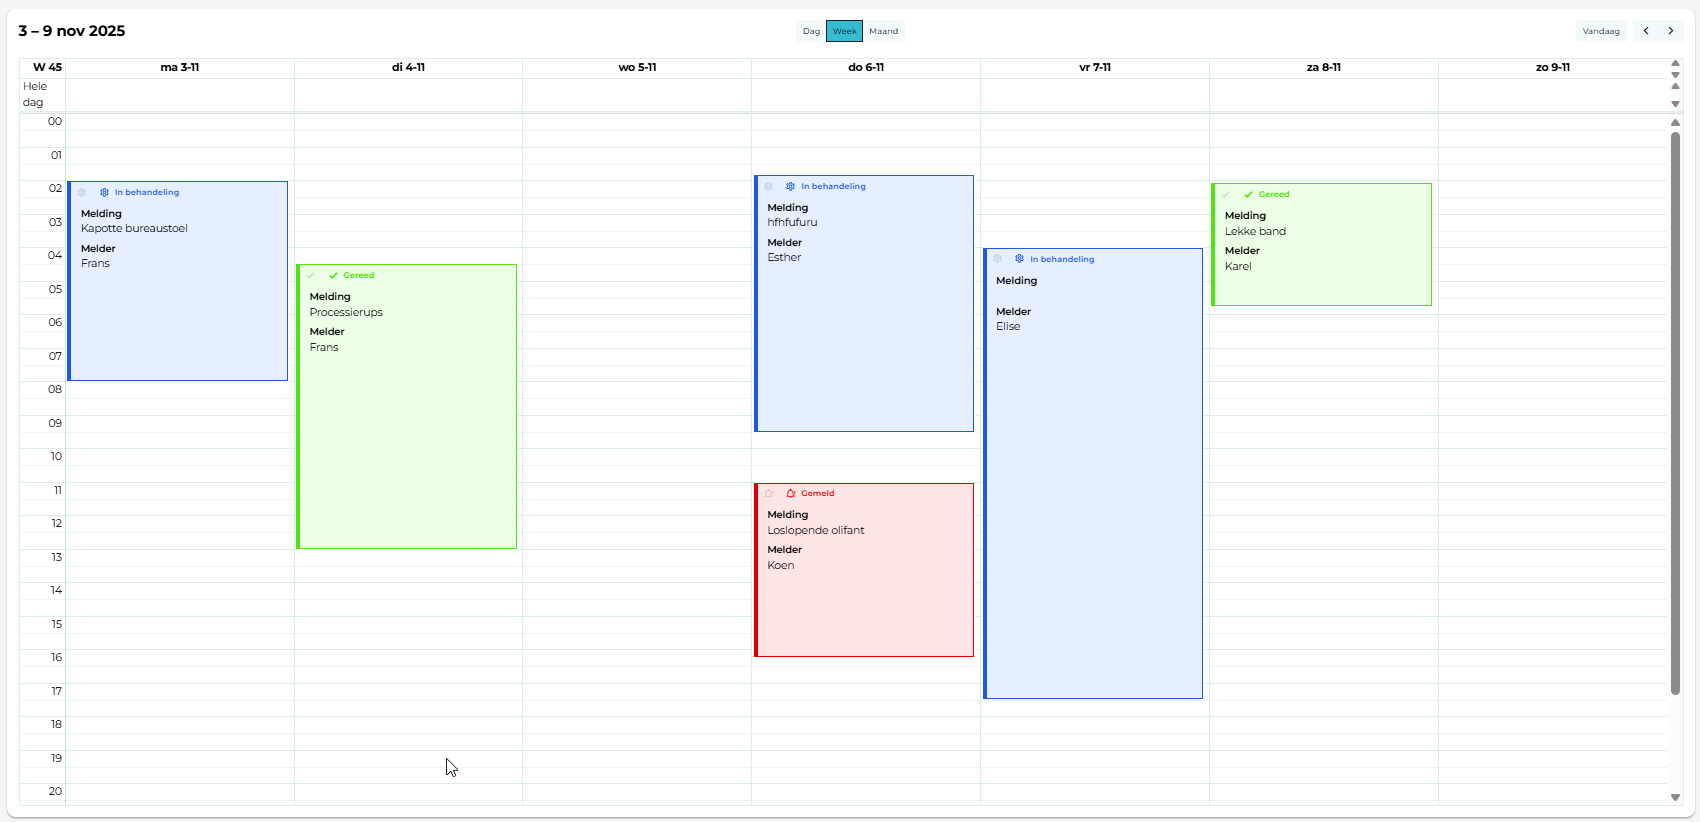
CalendarView
The calendar view places Assets using their start and end times. The AssetType needs two DateTime properties: one for the start and one for the end.
Choose which properties appear directly on a calendar item, including an image if required. Icon and colour mapping can also be configured.
TimelineView
The timeline displays Assets in a Gantt view. This also requires DateTime properties for the start and end.
A configured grouping brings time blocks together in one view. To display available and requested capacity alongside each other, dashboards also offer the ResourcePlanning widget.
From overview to action
Decide whether the add button is visible and whether the filter panel starts expanded. The add button is intended for a new Asset of the type displayed in the dataview.
Connect a process to clicking an Asset or the add button. A clicked Asset is passed as an argument. If no process is configured, the standard Asset detail view opens with its associated dashboard.
Choose which Asset dashboards are available from a dataview. Where there are several, users switch between them using tabs. A dataview can also be included as a dashboard widget with a saved filter; this embedded version has no filter panel of its own.
Tell us how it works today, where it gets stuck and what you want to change.